Show every customer when the system pays for itself
Reonic simulates production, self-consumption and energy flows, then turns them into payback, yield and self-sufficiency the customer can see. Tune the assumptions and compare variants side by side.
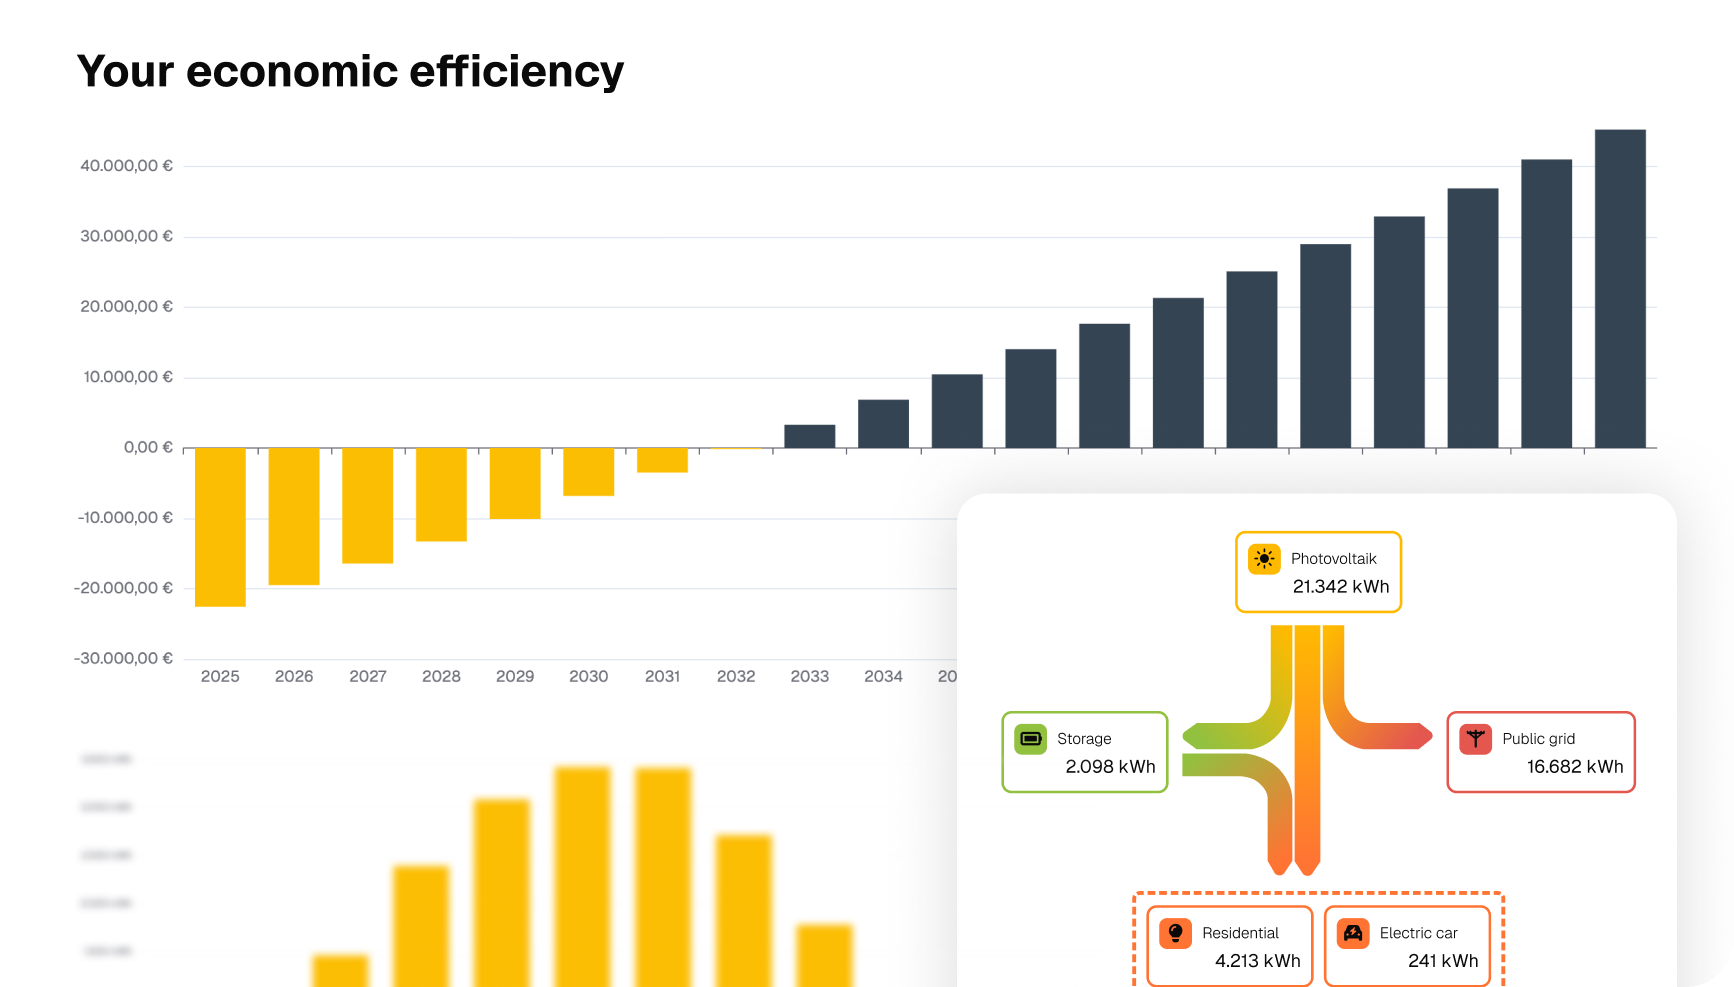
From a design to a number the customer believes
Reonic models the whole energy picture of a system, production, consumption, storage and the grid, and turns it into the figures that close a deal: payback, yield and how independent the household becomes.
Energy-flow simulation
See production, self-consumption and grid feed-in as a Sankey diagram, the clearest way to show a customer where their solar power actually goes.
PV production forecast
Monthly and yearly yield calculated from the actual design and location, not a rule of thumb.
Self-consumption & autarky
How much of the solar power the household uses itself, and the self-sufficiency level, with and without a battery.
EV and heat-pump demand
Add the extra load from a wallbox or heat pump so the self-consumption and payback numbers stay realistic.
Payback, yield and IRR
Investment, payback period, IRR, feed-in revenue and break-even, all calculated from the system you planned.
Compare variants side by side
Put two or three designs next to each other with KPI cards for total cost, payback and annual savings.
Battery arbitrage
Charge the battery when grid electricity is cheap and discharge when it's expensive. The simulation optimises the schedule for residential and commercial projects.
Future tariff comparison
Set the tariff the customer will have after the installation. The offer PDF and the digital offer show the old and the new tariff side by side.
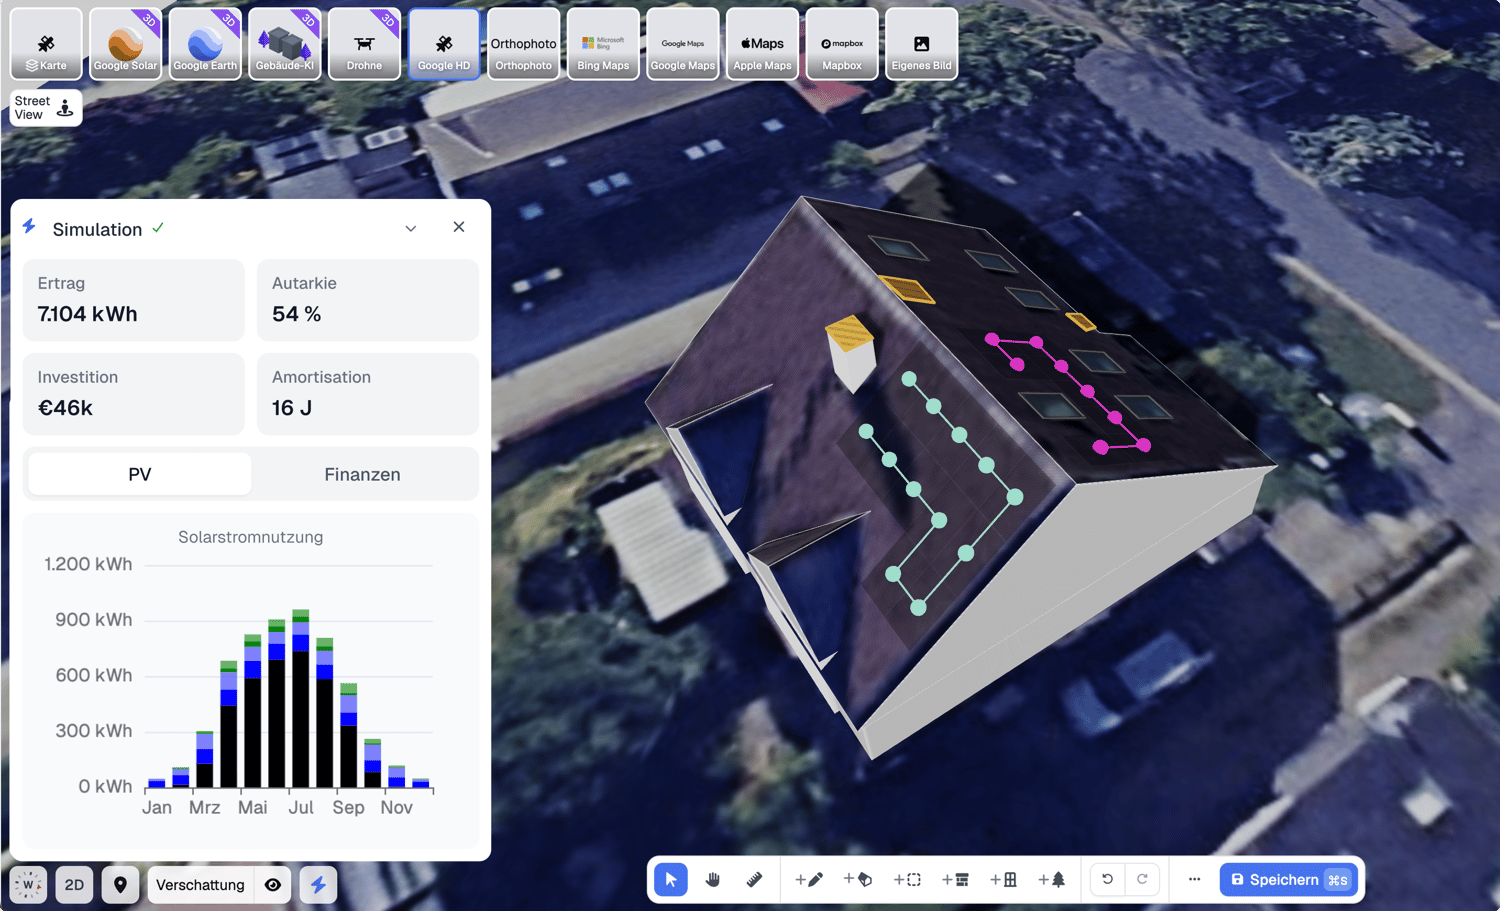
The simulation runs live while you design
Reonic calculates the simulation results right inside the design, while you're still laying out the PV system. Every change updates the numbers immediately, so you spot the best setup faster instead of recalculating after the fact.
Find the design with the shortest payback without leaving the layout
No separate calculation step before you can show the customer a number
See the whole energy picture
Reonic simulates where every kilowatt-hour goes across the year: what the PV system produces, what the household uses directly, what the battery stores, and what flows to the grid. The Sankey diagram makes it obvious at a glance, and a battery visibly shifts the flows toward self-consumption.
Self-consumption rate and self-sufficiency (autarky) at a glance
See how a battery shifts the flows and lifts self-consumption
EV charging and heat-pump demand included in the model
Profitability you can tune, variants you can compare
The economics page gives you payback, IRR, feed-in revenue and break-even from the system you planned. Adjust the electricity and gas prices and the assumptions behind the numbers, then put variants side by side so the customer picks with the full picture in front of them.
Tune electricity and gas prices and the assumptions behind the numbers
Compare variants side by side: total cost, payback, annual savings
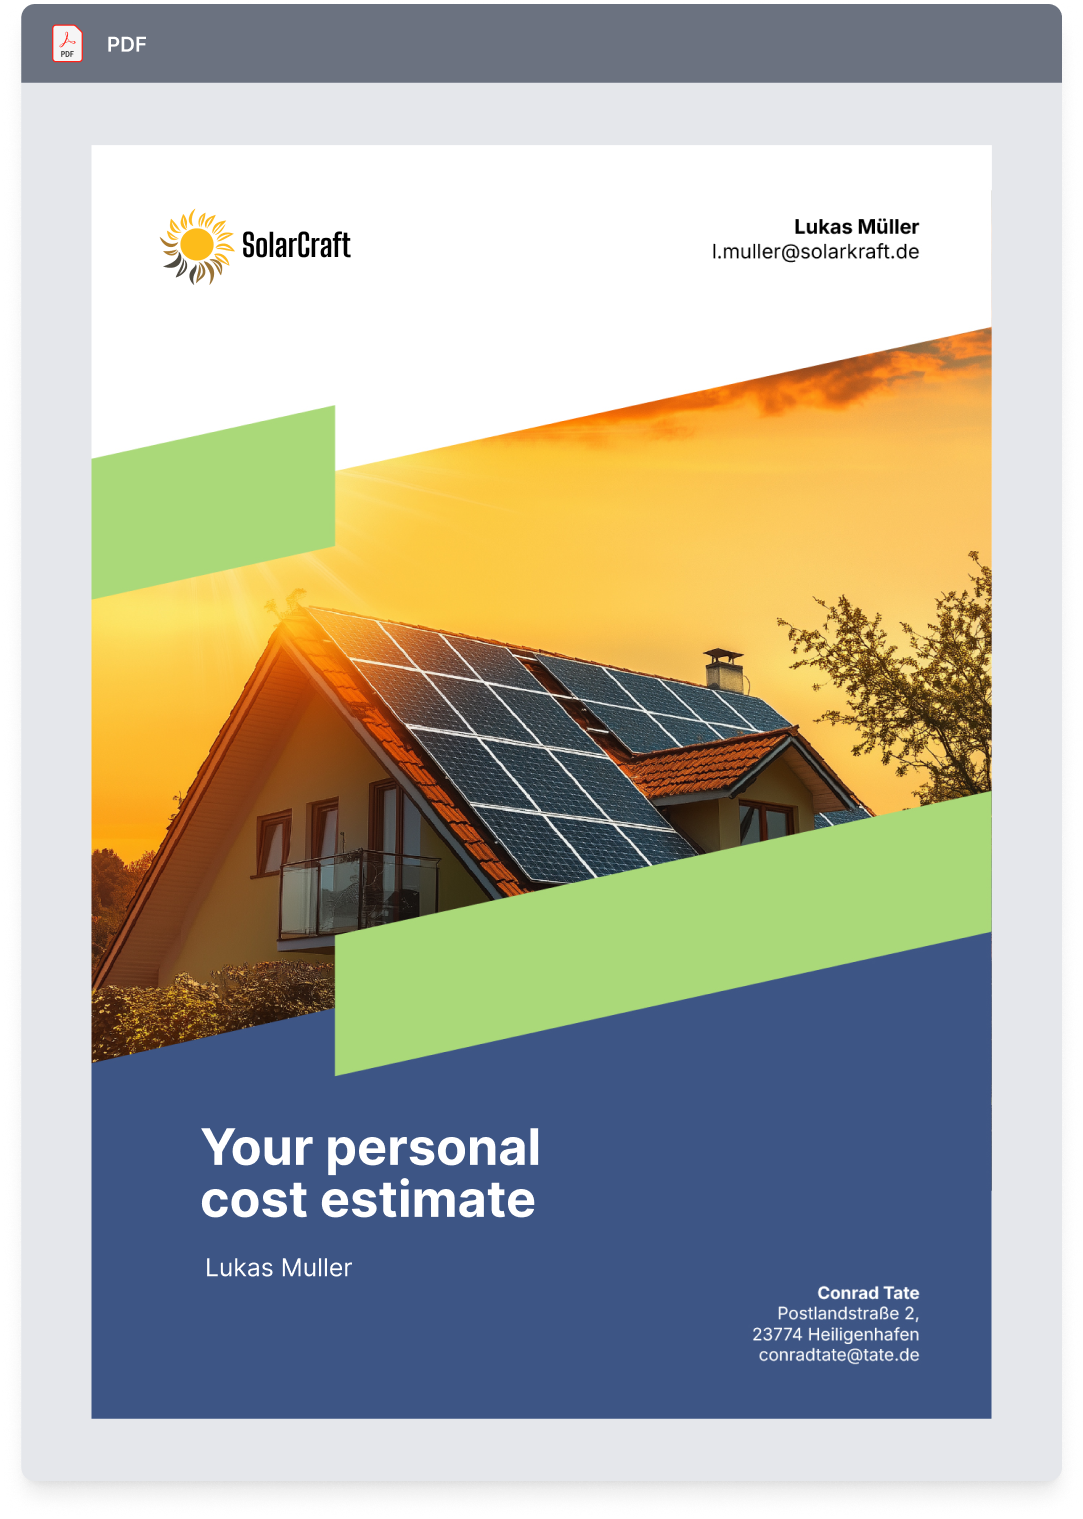
The economics flow straight into the offer the customer signs
Yield forecasts validated against PVGIS
The simulation calculates diffuse irradiance with Muneer's model, the same method PVGIS uses, the EU Commission's reference tool for photovoltaics. We validated the results against PVGIS on more than 24,000 real planned panels. The outcome is noticeably more accurate yield forecasts for every design.
Validated against PVGIS on more than 24,000 real planned panels
Noticeably more accurate yield forecasts, straight from your design
Book a demo. Get to know all products and features.
In a personal product presentation, we'll show you all products and features. Free of charge, no obligation and tailored to your business and needs.

It turns a planned PV, battery and heat-pump system into the figures a customer cares about: investment, payback period, yield, IRR, feed-in revenue, self-consumption rate and self-sufficiency. The numbers come straight from the design and the customer's consumption.
It depends on the system size, the household's consumption, self-consumption rate and electricity price. Reonic models all of these and shows the payback period for each variant, so you can answer the question with the customer's own numbers instead of a rule of thumb.
Reonic divides the system cost by the annual benefit, the self-consumption savings plus feed-in revenue, taking the modelled production, consumption and prices into account. Battery and any EV or heat-pump load feed into the same calculation.
Self-consumption is the share of solar power the household uses itself instead of feeding it to the grid. Autarky (self-sufficiency) is the share of the household's demand covered by its own system. A battery raises both, and Reonic shows the effect with and without one.
The forecast uses the actual roof design, orientation, tilt and shading, and calculates diffuse irradiance with Muneer's model, the same method PVGIS uses. We validated the results against PVGIS on more than 24,000 real planned panels. When accuracy matters for the offer, you can refine the forecast with measured consumption.
Yes. EV-charging demand and heat-pump electricity demand are modelled as additional load, so the self-consumption and payback numbers reflect the whole home, not just the PV system.
Yes. Build two or three designs and Reonic shows them side by side with KPI cards for total cost, payback and annual savings, so the customer can choose with the trade-offs in front of them.
Yes. The production, self-consumption and economics pages flow straight into the offer PDF and the customer portal. You can also hide them for a clean trades-style quote when a customer doesn't want the detail.